 Sizu
A line that climbs steeply looks like urgent news, and a flat one looks like nothing to discuss. But steepness is partly a choice made by whoever drew the chart. It depends on the data, on how much of the axis the data fills, and on how wide and tall the chart is. Knowing how to work the angle out takes about a minute, and it lets you tell a real surge from a stretched picture.
One rise, three charts
Marisol’s company sold $250,000 of garden furniture in January and $255,000 in December. That is a rise of $5,000, or 2% over the year. Now draw it three ways.
- A wide meeting-room slide, 1,000 pixels wide and 300 tall, with the axis from 0 to 300 (in thousands). The $5,000 rise is 5 out of 300 of the height, about 5 pixels. The line is nearly flat.
- The same slide with the axis zoomed to 248 to 256. Now the rise is 5 out of 8 of the height, 187.5 pixels. The line climbs steeply.
- A tall phone chart, 300 pixels wide and 500 tall, with the axis from 249 to 256. The rise is 5 out of 7 of the height, about 357 pixels over a narrow width. The line shoots up.
Nothing in the spreadsheet changed. The data is the same twelve numbers. Only the chart did.
How to work out the angle
The rise on the page is the change as a share of the axis range, times the chart’s height. The slope is that rise divided by the chart’s width, and the angle is the arctangent of the slope.
- Wide slide: rise = 5 ÷ 300 × 300 = 5 px; slope = 5 ÷ 1,000 = 0.005; angle ≈ 0.3°.
- Zoomed axis: rise = 5 ÷ 8 × 300 = 187.5 px; slope = 187.5 ÷ 1,000 = 0.1875; angle ≈ 10.6°.
- Phone: rise = 5 ÷ 7 × 500 = 357.1 px; slope = 357.1 ÷ 300 = 1.19; angle ≈ 50.0°.
The share of the chart’s height that the change fills is the quickest thing to read off a chart. If a change that is small in real terms fills most of the height, the axis has been zoomed in.
Does zooming in count as lying?
Not always. A reservoir manager really does need to see a 0.6-point dip from 81.2 to 80.6, and a chart with the axis from 80.5 to 81.3 shows it filling 75% of the height. That is the right picture for someone who must act on a small change, as long as the axis is labelled and nobody pretends the dip is large. The problem is not zooming. It is zooming without saying so, or choosing the zoom to push a conclusion.
What to ask about any slope
- How tall is the axis range compared with the change? A tight range makes a small change big.
- Where does the axis start? Check the first tick label.
- What shape is the chart? A tall, narrow chart makes everything steeper than a wide, short one.
- What is the change in real numbers? Go back to the two values and work out the percentage yourself. Here it is 2%.
- Would I draw it this way for a different conclusion? If yes, someone may have.
Try it with your own numbers
The free How Steep Does It Look? calculator takes a start value, an end value, the axis range and the chart’s size, and shows the share of height, the slope and the angle. It opens on the example above. It is a companion tool from Charts and Graphs Didn’t Have to Be This Hard, which shows every trick beside its honest twin.
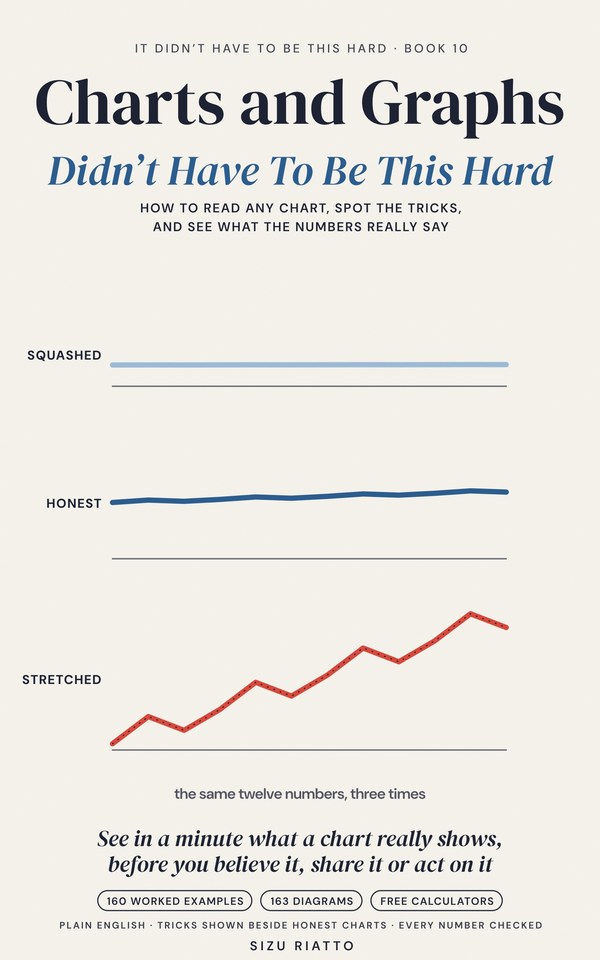
Marisol’s sales are an invented example for practice.