 Sizu
Home › Books › Calculus Didn’t Have to Be This Hard
What you’ll get from it
- Read any rate (a speed, a bill, a growth figure, a headline about something “slowing down”) and know exactly what kind of number it is.
- Turn a rate into a total and a total into a rate: a power curve into a bill, a flow into gallons, a speed into miles.
- Find the best answer to a problem with a trade-off in it, and see why the best point is where the slope goes flat.
- Understand growth that feeds itself, decay, half-lives and cooling, and why so many things follow the same curve.
- Walk into a calculus course already understanding what it’s about, or keep up with a teenager who’s taking one.
What this book is
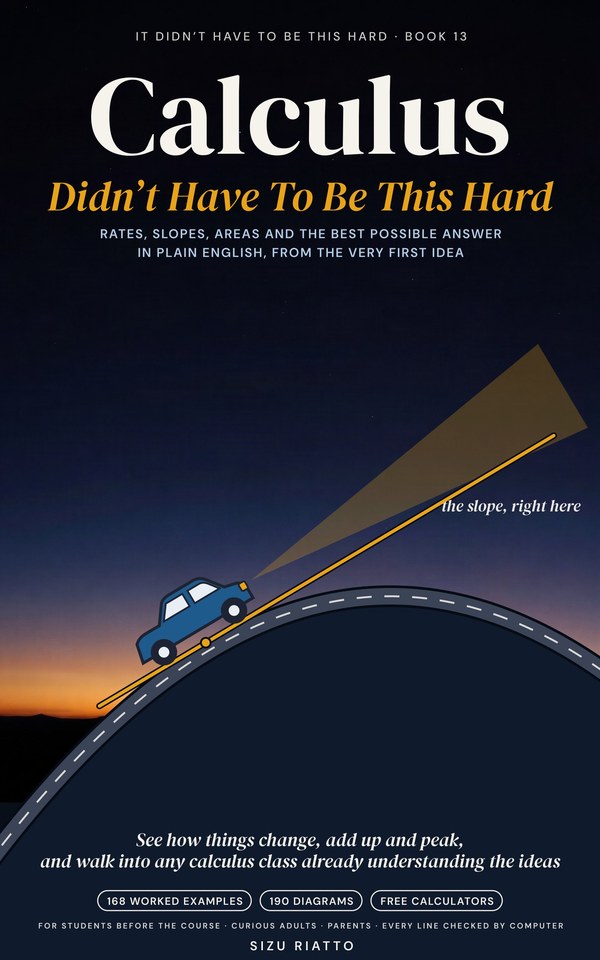
Calculus is the math of change, and it asks two questions: how fast, right now? and how much, altogether? A car’s speedometer answers the first and its odometer the second, and the surprise at the heart of calculus is that each question is the other one run backward. This book builds the whole subject from those two dials, with a picture and a small number case for every idea before it gets a symbol: zoom lenses that turn a curve straight, settling tables of numbers, thinner and thinner slices under a curve, tanks filling, coffee cooling, a box folding out of a sheet of cardboard.
It builds in order. Part One is change you already know: rates, graphs that move, slope and the average rate. Part Two answers the first question: the speed at one instant, limits, the derivative, the shortcuts and the rate of a rate. Part Three puts it to work: chains of rates, peaks and valleys, the best shapes, the best price, things that change together and straight-line estimates. Part Four answers the second question: from speed to distance, slices, the integral, the big link between the two questions and totals from rates. Part Five is change that feeds itself: e, growth, decay, cooling, flows in and out, and calculus in an ordinary week. Every calculated figure was computed by program and checked a second way, and every line in the book’s sum boxes (each derivative, integral, limit and solving step) was read back off the finished pages and checked.
Who it’s for
Students a few weeks or months before a first calculus course, in high school or college; students in a course whose symbols have run ahead of the meaning; adults who always wondered what calculus is, or who meet rates, curves and growth at work; and parents or relatives of a teenager taking calculus. You need arithmetic and a little algebra; the book rebuilds slopes, powers and graphs where it needs them. It covers the ideas of a first course, not every technique a course drills, and leaves the calculus of sines and cosines for later. Not tied to any test or course, and no grade is promised. Every story is invented to show an idea; physical situations are simple, labeled models, not professional advice.
Every chapter, its worked examples, and its free calculator
The calculators are free, need no sign-up, and keep what you type in your own browser. Each opens with its chapter’s worked example loaded, shows its working step by step, and draws the chapter’s picture from your numbers. The book is complete without them. All of them are also on the calculators page.
Part One · Change You Already Know
Calculus asks two questions about anything that changes: how fast is it changing right now (a rate, pictured as the slope of a graph), and how much has built up altogether (a total, pictured as the area under a rate graph); steady rates need only rate × time, and calculus is what handles rates that won't hold still.
Calculator: Rate and TotalWorked examples 1–6
- A speedometer and an odometer: 45 mph for 20 minutes
- How long a draining phone battery will last at its current rate
- Filling a bath when the tap is turned down halfway
- A steady savings habit against one that grows a dollar a week
- The steepness of a road at five points along a hill
- A bus route's average speed, and why the bus is rarely doing it
A rate is one change divided by another, its units are a fraction ("per" means divide) that tell you whether to multiply or divide, a flipped rate (pace, gallons per 100 miles) often tells the truth more plainly, and most real rates change from moment to moment.
Calculator: Rate FlipperWorked examples 7–13
- A week's pay from an hourly rate, with the units canceling
- Running pace and speed, and how long a 5K takes
- Which car upgrade saves more fuel, using gallons per 100 miles
- What an evening with a space heater costs
- How long a download takes: bits, bytes and megabits per second
- How long a coffee urn lasts at the morning's selling rate
- A draining bathtub whose level falls fast, then slow
On a distance–time graph the steepness is the speed (steep is fast, flat is stopped, straight is steady, bending up is speeding up, bending over is slowing down), on a speed–time graph the height is the speed and the area under it is the distance, and a curve means the speed itself is changing.
Calculator: Trip Graph MakerWorked examples 14–20
- Reading three walking speeds off a distance–time graph
- A bus at a stop: what a flat stretch on a graph means
- A bike ride's climb, descent and flat on one graph
- A car speeding up from a red light, second by second
- One walk drawn as a distance graph and as a speed graph
- When a spring day warms fastest, and why that isn't the warmest hour
- Why a phone charges fast to 80% and slowly after
Slope is rise ÷ run (written Δy ÷ Δx), it is the same everywhere on a straight line, it can be zero or negative, it is always a rate with units, and grade, pitch and ramp ratios are the same idea in trade language; a curve has a different slope at every point.
Calculator: Slope and GradeWorked examples 21–27
- How far a road climbs on a 6% grade over 2 miles
- A 6-in-12 roof pitch as a slope and a rise
- How long a 1:12 ramp must be for a 2-foot rise
- A taxi's charge per mile and starting fare from two receipts
- A draining tank's negative slope in gallons a minute
- Half an inch of rain an hour, per day and per minute
- Slopes between points on y = x², and why a curve has no single slope
An average rate is total change ÷ total change over a stretch, the slope of the secant line joining its ends; it hides what happened in between, it must be worked from totals (never by averaging rates held for different times), a smooth trip hits its average at some instant (the mean value theorem), and shrinking the stretch toward one point makes the averages settle on a single number.
Calculator: Average Rate FinderWorked examples 28–34
- What a bus schedule averaging 15 mph would really require
- Why 30 mph out and 60 mph back averages 40, not 45
- A falling ball's average speed between 1 and 3 seconds
- A savings balance's average growth, and the speeding up it hides
- Average-speed cameras and the mean value theorem
- A hill climb's average speed, climbing rate and grade
- Average speeds over shrinking intervals that settle on one number
Part Two · How Fast, Right Now
The speed (or any rate) at a single instant is the number that average rates settle on as the stretch of time shrinks toward zero; in a picture it's the slope of the tangent line, the straight line a smooth curve looks like when you zoom in far enough.
Calculator: Zoom-In SlopeWorked examples 35–41
- A falling ball's speed at exactly 2 seconds, from shorter and shorter averages
- The ball's speed checked from just before 2 seconds
- Zooming in on y = x² until it looks straight (slope 6 at x = 3)
- How a bike watch turns positions a second apart into a current speed
- A sunflower's growth rate from shorter and shorter measuring windows
- A jagged share price: why it has no speed at an instant
- The grade at a point on a highway crest curve: the tangent line
A limit is the value a quantity heads for as its input closes in on something, whether or not the input ever arrives; it lets calculus talk about zero time without dividing by zero, turns 0 ÷ 0 into a signal to tidy the algebra first, and also describes long-run values and the places (jumps) where no single value is approached.
Calculator: Limit TableWorked examples 42–48
- Zeno's halves: an endless sum that adds up to one mile
- Extra soil per extra foot of side for a 3-foot square planter
- Why 0 ÷ 0 isn't an answer, and the algebra that removes it
- The difference quotient for x², and its exact limit
- A 3D printer's cost per print in the long run (a limit at infinity)
- Compounding $1 at 100% yearly, monthly and daily: a ceiling
- A parking fee that jumps at one hour: a limit that doesn't exist
The derivative of a function is a second function that gives its slope (rate of change) at every input, written f′(x) or dy/dx, in output units per input unit; it is positive where the function rises, negative where it falls and zero at its flat tops and bottoms, and you can sketch it straight from a graph.
Calculator: Slope MachineWorked examples 49–55
- The derivative of x² for every point at once: 2x
- A skate ramp's slope at every point
- The hottest hour and the fastest-warming hour of a summer day
- A draining hot tub: gallons per minute as a derivative
- Marginal cost: what one more pound of roasted coffee costs
- A data plan's cost: why a fixed charge drops out of the rate
- Sketching a bus's speed graph from its distance graph
To differentiate a whole-number power of x (the rule holds for other powers too), bring the power down in front and lower it by one; constants have slope zero, and multiples and sums go through term by term, so any polynomial can be differentiated in one line, and the pictures (a square's two strips, a cube's three slabs, a circle's rim) show why.
Calculator: Power-Rule DerivativeWorked examples 56–62
- How fast a square deck's area grows as its side grows
- How fast a cube's volume grows, and why big ice lasts longer
- A sales trendline differentiated term by term
- Where 16t² comes from: gravity, and the falling ball's speed
- A ball thrown upward: rising, level at the top, falling
- A round pond: the area grows at the rate of the rim's length
- Why highway crests are parabolas: a grade that changes evenly
The second derivative is the rate of change of the rate of change: acceleration for motion, the bend of a graph (positive is a cup, negative a frown), and the difference between "rising" and "rising more slowly"; where the bend flips is the inflection point, where the rate itself is biggest.
Calculator: Position, Speed and AccelerationWorked examples 63–69
- 0 to 60 mph in 8 seconds as an acceleration
- Distance, speed and acceleration of a falling ball
- "Price rises are slowing": a headline read as a second derivative
- Highway crests and sags: the sign of the second derivative
- The day a library app's sign-ups grew fastest: an inflection point
- Braking distance and the square of speed (UK Highway Code table)
- A cyclist's sprint: accelerating less and less to top speed
Part Three · Rules and the Best Answer
When one quantity drives another, rates multiply down the chain (dy/dx = dy/du × du/dx, "the outside's rate times the inside's"), and units cancel link by link; when two changing quantities are multiplied, the product's rate is each one's change times the other, added (the two strips of a growing rectangle), because the little corner vanishes for small changes.
Calculator: Chain of RatesWorked examples 70–76
- A bicycle's speed from pedal turns, gear ratio and wheel size
- What a highway drive costs per hour in gas
- How fast a square garden patch grows as planks are added (the chain rule)
- The air needed to grow a balloon by half an inch a second
- A garden plot growing in both directions (the product rule)
- A bike shop's revenue when the price rises and sales fall
- Converting a kettle's warming rate from Celsius to Fahrenheit
At a smooth peak or valley the slope is zero, so the candidates are where f′(x) = 0; the sign of the slope before and after (or the sign of f″) tells a peak from a valley from a mere pause, and when the question has limits, the ends are candidates too.
Calculator: Peak FinderWorked examples 77–83
- How high a thrown ball goes, and when
- The warmest hour of a model summer day
- The cheapest thickness of attic insulation in a simple cost model
- Telling a crest from a dip on a fair ride's track
- The warmest moment of a morning practice: an end, not a peak
- A road that goes level for an instant and keeps climbing
- A local peak against the highest point of a whole stretch
Optimization is five steps (draw it, name the letters, write the thing to make best, use the rule to leave one letter, set the slope to zero and check the ends), plus a sixth that the math can't do: ask what the formula left out, as the soda can shows.
Calculator: Best Shape FinderWorked examples 84–89
- The most area roped off with 100 feet of rope
- The biggest garden from 120 feet of fence beside a river
- The biggest open box from a square of cardboard
- The least paper for a menu poster with margins
- The least-metal shape for a 12-ounce can, and why real cans differ
- The cheapest route for a water pipe along a road and across a field
Profit is revenue minus cost, revenue is price × quantity sold with quantity falling as price rises (a demand line you must assume and then test), and the most profit comes where marginal revenue equals marginal cost; with a straight demand line, the best price is the revenue-best price plus half the unit cost, and many cost trade-offs of the form a/x + bx are cheapest where the two parts are equal.
Calculator: Best Price FinderWorked examples 90–95
- A coffee cart's price for the most revenue
- A coffee cart's price for the most profit
- The best number of cups from marginal revenue and marginal cost
- The daily output that gives a bakery its lowest average cost per loaf
- How many bags to order at once (the economic order quantity)
- The cheapest speed in a delivery van cost model
When two quantities are tied by a rule that holds at every moment, write the rule, take the rate of both sides with respect to time (the chain rule gives each changing quantity its own rate), and only then put in the moment's numbers; the unknown rate is the known rate divided by the link between them, which can change even when the known rate is steady.
Calculator: Changing TogetherWorked examples 96–102
- How fast a water tank's level rises from the pump rate
- Why a growing cone of sand rises more and more slowly
- How fast a ladder's top slides down as its foot is pulled out
- How fast a spreading puddle's area grows
- How fast a balloon's radius grows from a steady pump
- How fast your shadow grows walking away from a streetlight
- How fast two buses heading north and east move apart
Near a point you know, a smooth curve is almost its tangent line, so new value ≈ known value + slope × step; that gives mental square roots, the rules that a small percent change in a length becomes about twice that in an area and three times in a volume (and that percent changes of a product add), how measuring errors grow, and Newton's method; the guess drifts as the step grows, by about the square of the step.
Calculator: Straight-Line EstimateWorked examples 103–109
- Square roots in your head from the tangent line
- How a 1% measuring error grows into a floor-area error
- How much more pizza a 14-inch holds than a 12-inch
- The uncertainty in a tank's volume from a measured side
- Compound interest for a few years, estimated in your head
- Newton's method: finding a square root by following tangent lines
- When the tangent-line estimate drifts too far
Part Four · Adding It All Up
Draw a rate against time and the area under the graph is the total: miles from speed, gallons from flow, kilowatt-hours from power; straight-edged graphs split into rectangles and triangles, and area below the axis counts as negative, so you can find both the net change and the total movement.
Calculator: Speed-to-DistanceWorked examples 110–116
- Distance from a steady speed: a bus at 30 mph for 12 minutes
- A bus speeding up from a stop: the triangle under the speed graph
- A whole bus leg from a tracker's speed graph, in three shapes
- Merging from 30 to 60 mph: a trapezoid and the right average speed
- Gallons pumped in an hour from a flow rate that changes
- Kilowatt-hours and cost from an oven's power
- Net change against total distance: a forklift that backs up
When a rate curves, cut the area under it into thin slices, add each slice's height × width (left edge, right edge, midpoint or trapezoid), and make the slices thinner until the total stops changing; with readings instead of a formula, the trapezoid rule turns any list into a total.
Calculator: Slice AdderWorked examples 117–123
- A go-kart's distance from its speed curve: left and right slices
- Midpoint slices: close to the true distance with only four
- Thinner slices: left and right sums squeezing the true answer
- A solar roof's daily kilowatt-hours from hourly readings (trapezoids)
- A cyclist's distance from a watch's 10-second speed log
- Total rainfall from a storm's rain-rate readings
- The area under a parabola by slices, after Archimedes
The definite integral is the total that thin-slice sums settle on; read ∫ as "add up", the small numbers as start and stop, and dt as a thin slice's width; it gives the net change (negative pieces subtract), and divided by the length of the stretch it gives the true average.
Calculator: Average ValueWorked examples 124–129
- Reading integral notation aloud: a plug-in car's overnight charge
- A tank that fills then drains: net change, total pumped and the fullest moment
- A day's true average temperature from its curve, not high plus low
- A car pulling away from a light: average speed from the integral
- A heat pump's kilowatt-hours and cost, and a solar day as one steady power
- A battery charged then used: net zero, but amp-hours still moved
The area-so-far under a curve grows at the curve's height, so the derivative of a total is its rate (the Fundamental Theorem of Calculus); to find the area from a to b, find any antiderivative F (run the power rule backward and check by differentiating) and compute F(b) − F(a), with + C standing for the starting value when you build a formula.
Calculator: Antiderivative StepsWorked examples 130–136
- Why an area grows at the height of its curve (the big link)
- The go-kart's exact distance by antiderivative instead of slices
- A hobby rocket's height at burnout by the reverse power rule
- What + C means: a bus odometer's starting reading
- The falling-ball formula built from gravity by two antiderivatives
- A tank filling at a rising rate, checked two ways
- Archimedes' parabola area in one line with the Fundamental Theorem
Any total that builds up from a changing rate is an integral: name the rate, choose what to slice along, make the units match, then slice, multiply and add; the same move gives a day's water or electricity, a growing income, a cone's volume by stacked disks, and braking distance, which grows with the square of speed.
Calculator: Energy From PowerWorked examples 137–142
- A town's daily water from a plant's flow curve (and the minutes-hours trap)
- A home's daily kilowatt-hours and cost from a smooth power curve
- Half a year of a growing side business: earnings from an income rate
- A funnel's volume by stacking disks, and why halfway up holds an eighth
- Braking distance from steady braking, and why it grows with the square of speed
- Visitors to a six-hour sale, and how many arrive in the rush
Part Five · Change That Feeds Itself
When something grows at a rate proportional to its size, it follows the number e (about 2.71828), the limit of compounding more and more often; e to the x is the curve (up to a constant multiple) whose slope equals its own height; its doubling time is ln 2 divided by the rate, about 70 divided by the percentage.
Calculator: Growth and DoublingWorked examples 143–149
- $1,000 at 5% compounded yearly, monthly, daily and continuously
- Bernoulli's question: compounding more and more often runs into e
- The curve y = eˣ, whose slope equals its height
- $5,000 growing continuously at 4% for 18 years
- Doubling time at 7% and the rule of 70
- A sourdough starter that doubles every 4 hours
- How long an amount takes to triple at 6%
Anything that loses a fixed fraction of itself in each equal stretch of time decays exponentially: half is gone in each half-life, the rate constant is ln 2 divided by the half-life, and Newton's law of cooling is the same rule applied to the gap between a hot object and its surroundings.
Calculator: Half-Life and CoolingWorked examples 150–156
- 80 grams with a 5-day half-life
- Dating charcoal with a quarter of its carbon-14 left
- The age of a sample with 60% of its carbon-14 left
- Hollis's coffee cooling to drinking temperature
- How fast coffee cools at the urn and at 140°F
- A $24,000 car losing 15% of its value a year
- Milk in the coffee now or later: which ends up hotter
When the rate of change depends on the amount itself, the rule is a differential equation, and you can always step it: Euler's method moves forward with the rate you have now, smaller steps give smaller errors, and setting the rate to zero finds the steady state where flow in equals flow out.
Calculator: Flow StepperWorked examples 157–163
- A leaky tub stepped forward a minute at a time
- Monthly deposits of $200 growing at 0.4% a month
- A $12,000 loan paid at $400 a month
- Smaller Euler steps for the leaky tub
- A skydiver's top speed in a simple drag model
- An app spreading through a town of 36,000
- Pilar's reservoir settling where inflow equals outflow
Calculus is two questions about change, how fast right now (the derivative, a slope) and how much altogether (the integral, an area), and the link that each one undoes the other; an ordinary week is full of both, and a calculus course adds notation, techniques, series and differential equations to the same ideas.
Calculator: All the CalculatorsWorked examples 164–168
- Distance, average speed and acceleration from a drive's speed graph
- An evening's kilowatt-hours from hourly power readings
- The best coffee price after the cost per cup rises
- $2,400 at 3% for six years, and its doubling time
- Reading "still rising, but more slowly" in a rent headline