 Sizu
Home › Books › Charts and Graphs Didn’t Have to Be This Hard
What this book is
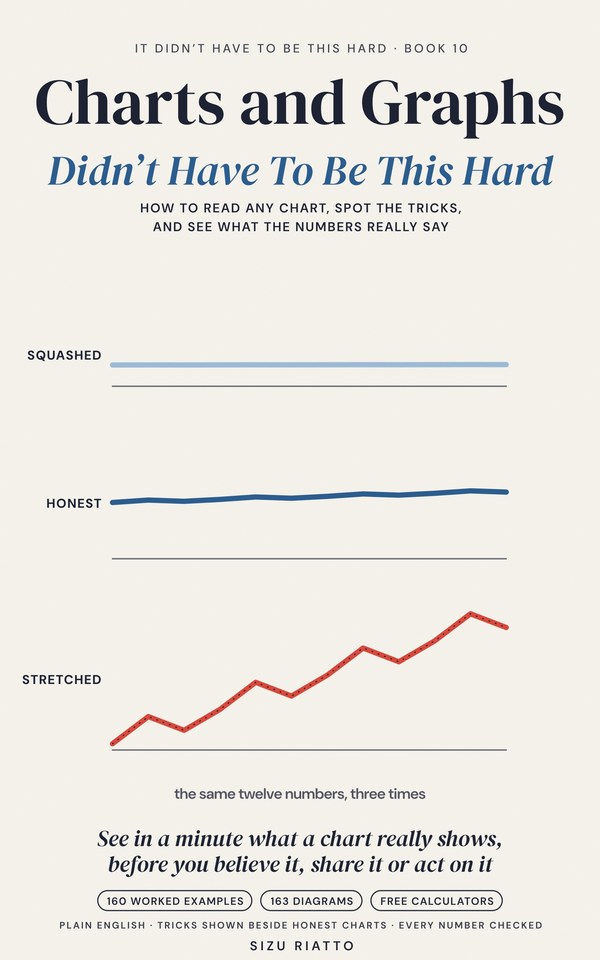
Chart reading explained slowly, in plain English, from the very beginning. Reading a chart well is a habit, not a talent: read the words before the picture, check where the axis starts and what one step is worth, ask “percent of what?” and “out of how many?”, notice who chose the start date, and turn a count into a rate. Each habit gets its own chapter, shown on real situations. Every trick is drawn twice from exactly the same numbers: the chart as it reached you, and its honest twin.
It builds in order. Part One is the foundation: what a chart is, axes and scales, choosing the right chart, percent and percentage points, counts and rates. Part Two shows the tricks of the scale: axes that don’t start at zero, stretched lines, two axes, pictures that grow both ways and log scales. Part Three shows the tricks of the data: cherry-picked windows, running totals, averages that hide, misleading maps and money over time. Part Four takes on headlines, polls, baselines, scatterplots and forecasts. Part Five covers ads and rankings, how to make honest charts yourself, and a sixty-second check for any chart. Every calculated figure was computed by program and checked a second way, every equation in the sum boxes was read back off the finished pages and checked, and every chart was drawn by program from the same numbers.
Who it’s for
Anyone who meets charts and numbers they didn’t make: in the news and on social media, in work meetings, vendor pitches and dashboards, in ads and on packages, in a class or a town report. Students, professionals who read and make reports, and anyone who forwards charts to family and friends and wants to be sure first. No math assumed beyond percentages, which the book rebuilds. Not political: the examples are sport, weather, shops, towns and work. Every story is invented to show an idea; it is about reading numbers, not financial or professional advice.
Every chapter, its worked examples, and its free calculator
The calculators are free, need no sign-up, and keep what you type in your own browser. Each opens with its chapter’s worked example loaded. The book is complete without them.
Part One · Reading Any Chart
A chart is an argument someone made with a picture, so read it from the words inward: the claim, what's measured and in what units, the axes, the comparison, the time window and source, and what's missing. Then read two numbers off it and work out the change yourself.
Calculator: The Sixty-Second Chart ReadWorked examples 1–7
- A vendor's chart that makes faster deliveries look four times faster
- A "bike thefts soar" headline, put into plain numbers
- Library visits up, card holders down: two charts, two measurements
- A bike shop's spring sales against the whole region's
- A phone maker's "40% longer battery life" claim
- Checking a ticket-price headline against its own chart
- A "rainiest summer ever" chart shared on a phone
An axis is a ruler: find the units, any multiplier such as "thousands", and what one step is worth, then read any point as the label below it plus its fraction of the gap. Check that equal distances mean equal amounts before trusting a slope or a bar.
Calculator: Read a Value Off a ChartWorked examples 8–14
- Reading a river level between two gridlines
- Counting ticks on a chart of fair visitors
- Library visits on an axis labeled in thousands
- A club's steady growth that looks like it stalled
- An ad whose axis steps from 20 to 50 to 100
- E-bike sales inside a stacked bar
- A weather chart in Fahrenheit and Celsius
Pick a chart by the question it answers: bars to compare categories (sorted, from zero), a line for one thing over time, a pie for a few clearly different parts of one whole, dots for relationships, and a table for a few exact values. Eyes judge positions on a shared scale better than angles or areas, which is why bars beat pies for close comparisons.
Calculator: Which Chart Fits?Worked examples 15–21
- Sorting a company's product lines by sales
- Website visits by month, and a line wrongly drawn through showrooms
- Four close sales regions as a pie and as bars
- A "pick any" survey drawn as a pie
- Customer complaints by type over three years
- This quarter's revenue against last year and the target
- Sales by channel as pies, bars and slope lines
A percent is always a percent of something. A change in a rate can be given in percentage points (the plain gap) or in percent (the gap compared with the start), and the honest description gives both; percent changes of different bases don't add, a fall and the rise that undoes it are different sizes, and a big percent of a tiny base is still tiny.
Calculator: Percent Change vs Percentage PointsWorked examples 22–28
- A forecast chance of snow from 10% to 15%
- A savings rate rising by a point
- A bike shop's takings up 50% and down 50%
- Children cycling to school: three times as many
- E-scooter complaints "up 100%"
- Park users who go every day, as a share of the town
- A price chart that says "recovers 20%" after a 20% sale
A count grows with the size of a place or group; a rate divides that size out (per person, per 1,000, per mile, per hour) so different sizes can be compared. Choose the denominator that matches your question, check the "per" and the time period on the axis, distrust the wild rates of tiny groups, and plan with totals.
Calculator: Counts to RatesWorked examples 29–35
- Library loans in a city and a small town, per person
- Pothole reports per 1,000 people
- Flat tires per 100 miles and per ride
- Water use on two streets
- Lost library books in a village of 450
- Snowplows assigned by miles of road
- Two bike mechanics' output per hour
Part Two · Tricks of the Scale
A bar's length is its number, so bars must start at zero; when a bar chart's axis starts higher, the bars show only the leftovers above that start, and a small difference can look several times its real size. Lines and dots can zoom in, as long as the axis is labeled.
Calculator: Bar Exaggeration and Lie FactorWorked examples 36–42
- A supplier's tire brochure whose bars start at 4,000 miles
- Measuring how much the tire brochure exaggerates (the Lie Factor)
- Redrawing the tire comparison as cost per 1,000 miles, from zero
- A weather presenter's chart of daily highs, where zero means nothing
- Average commute times by district as a zoomed, labeled dot plot
- A school bake sale's bars with a zigzag break on the axis
- A bike shop's repair report whose biggest bar runs off the chart
How steep a line looks is decided by the y-axis range, the chart's height and its width, not only by the data; zooming in turns small wobbles into drama and zooming out hides real change, so read the start and end values and say the change in numbers.
Calculator: How Steep Does It Look?Worked examples 43–49
- One year of sales drawn wide, zoomed and on a phone
- A social-media post about a reservoir "plunging" on a zoomed axis
- A climbing wall's growing bookings squashed by a shared dashboard axis
- Working out how steep a line will be drawn, in pixels and degrees
- Two stores' sales charts side by side on different scales
- A support team's response times on a spreadsheet's default axis
- Labeling the change on a sales chart so the slope can't mislead
On a chart with two y-axes, each line's axis range is chosen separately, so where the lines sit, cross or run together is the chart maker's choice; compare each line with its own start, index both to 100, or give each its own chart.
Calculator: Index Two Series to 100Worked examples 50–56
- A viral dual-axis chart of coffee shops and bike commuters
- The same dual-axis chart with the right axis changed
- Choosing a right axis that makes two lines lie on top of each other
- Comparing coffee shops and commuters by indexing both to 100
- Percent change and commuters per coffee shop instead of two axes
- A delivery report with orders as bars and the on-time share as a line
- A temperature chart with Fahrenheit and Celsius axes
A picture made twice as tall keeps its shape and so becomes twice as wide, covering four times the page (and a 3-D picture seems to hold eight times as much); scale the area to the number, size bubbles by area, avoid 3-D, or use bars and same-size icons.
Calculator: Picture Size CheckerWorked examples 57–63
- A dairy flyer that draws doubled milk sales as a bottle twice as tall
- A box twice as big each way
- Scaling a picture by area so twice as much looks twice as big
- A bubble chart of park visitors sized by radius and by area
- Bike-lane riders shown as a pictogram of equal icons
- Four equal slices of a tilted 3-D pie chart
- A phone ad's battery icons scaled in two directions
On a log axis each equal step multiplies by the same amount, so steady percent growth is a straight line and its slope is the growth rate; a flatter line means slower growth, not shrinking, and equal-looking gaps are equal ratios, not equal amounts.
Calculator: Read a Log AxisWorked examples 64–70
- An app's users doubling monthly, on linear and log axes
- Reading the halfway point between gridlines on a log axis
- Two apps of different sizes growing at the same rate
- An app whose growth slows from doubling to 10% a month
- Populations from a hamlet to a city on one chart
- Equal-looking gaps on a log axis that differ a hundredfold
- Counting doublings on an axis where each gridline doubles
Part Three · Tricks of the Data
A change depends on where you start and stop, and a bumpy record offers a wide menu of true percentages; ask "from when, to when, and why those two?", compare a month with the same month a year earlier, and look at the whole record.
Calculator: Start-and-End Date ExplorerWorked examples 71–77
- Two opposite press releases about one bike lane, both true
- How the starting month sets the size of a change
- A pool's winter "collapse", compared with last winter
- A bike shop's record month against its whole year
- Every possible start and end on one record, counted
- A market's three-year climb inside its ten-year record
- "Busiest since counting began" on a two-year record
A running total adds each period to everything before, so it can only climb and a slowdown shows only as a bend; look at each period's own amount, the size of the latest step, and the raw numbers behind any rolling average or year-to-date figure.
Calculator: Running Total vs Per PeriodWorked examples 78–84
- A members' total that climbs while new sign-ups fall
- Reading each month's sign-ups from the running total's steps
- Joined, or still here?
- A sandwich shop's lifetime total against its yearly sales
- A three-week average that spots a drop two weeks late
- Year-to-date orders hiding a falling second quarter
- A fundraising thermometer, and the pace needed to finish
An average stands in for a whole pile of numbers and hides its spread, its shape, its outliers and the sizes of its groups; ask to see the dots, ask whether it's the mean or the median, weight groups by size, and ask what the error bars measure.
Calculator: Mean, Median and the Spread Behind a BarWorked examples 85–91
- Anscombe's quartet: same summaries, four different pictures
- Two delivery firms with the same average and different spreads
- Mean and median repair bills when one job is huge
- Love it or hate it
- Combining two class averages of different sizes
- Three different error bars on the same average
- Household sizes on one street, and the average no home has
A shaded map is read by area and color, so a map of counts mostly shows where people live, big empty areas get a voice far larger than their people, and cut points chosen by someone decide how dark it looks; map rates, read the legend's numbers and direction, and check the population of the smallest places.
Calculator: Counts to Rates for a MapWorked examples 92–98
- A library sign-up map by count and by rate
- A big rural district that dominates a map with few people
- The same map shaded with two sets of cut points
- A tiny district's rate, moved by a single person
- One dot per hundred sign-ups, and the places that vanish
- A map whose legend runs dark for low
- When bars beat a map
Dollars shrink as prices rise, so money over time must be measured with one yardstick: real value = nominal value × (index now ÷ index then), per person when the population changed, and per year as a compound rate, not a simple division.
Calculator: Prices in Today's MoneyWorked examples 99–105
- An old movie ticket price in today's money
- A ticket price that sets a record every year in dollars
- Two bike costs that rose by the same dollars at different rates
- Turning a rise over four years into a yearly rate
- "The biggest library budget ever", in real terms per person
- A ticket in minutes of work
- A summer job's raise after rising prices
Part Four · Numbers in Headlines, Polls and Forecasts
A relative change ("doubles", "cut by 75%") compares a chance with itself; only the absolute change, counted out of 100 or 1,000, tells you how much difference it makes, so always ask "out of how many?" and "over what time?".
Calculator: Relative vs Absolute ChangeWorked examples 106–111
- A travel site's "doubles your chance of a delay", as counts per 100 trips
- Lost luggage on tight connections, drawn as 1,000 bags
- A lock maker's 75% claim, and how many riders must switch for one fewer theft
- Two "50% fewer" claims (packages and rain forecasts) put on one scale
- A phone case's "cuts cracks by 75%" sticker against the box's fine print
- A small yearly chance of hail damage over ten years of owning a car
A random sample's margin of error is about 1 ÷ √(number asked), so read every poll as a range, treat a lead smaller than about twice the margin as too close to call, and remember that no margin of error fixes the wrong people or a leading question.
Calculator: Poll Margin and Lead CheckerWorked examples 112–118
- A town survey of 600 residents and its margin of error
- A 52% to 48% playground vote: is the lead bigger than the wobble?
- Twelve monthly polls that "plunge" while opinion stays put
- Teenagers within a survey: a smaller group, a wider margin
- An open online vote of 5,000 against a random sample of 400
- An ad's "9 out of 10" from ten people asked
- Two wordings of one survey question, two different answers
A number means nothing until it's compared with something, so ask for its normal range, how long its record is, the size of the whole it came from, and how much it usually wobbles before you decide it's big.
Calculator: Is This Unusual?Worked examples 119–124
- "Hottest October day in five years" against thirty years of records
- How often a record happens by chance in a short record
- A "wettest May in a decade" against ten years of monthly rain
- What a 40% chance of rain means
- A city's bike-theft count turned into a rate per 100 bikes
- Library visits "up 6%" against the usual month-to-month swing
A scatterplot and its correlation show how two things move together among the dots you have; they can't show which causes which, what happens past the last dot, or what a third factor or one outlier is doing, so always look at the dots.
Calculator: Fit a Line and Check ItWorked examples 125–130
- Seats and coffee sales at twenty cafés: correlation and trend line
- One station kiosk that drags a trend line and its correlation
- A trend line stretched to a 300-seat food hall
- Streetlights and library members that rose together as a town grew
- Simpson's paradox: Berkeley in 1973 and two bike-repair shops
- Two scatterplots with nearly the same correlation and different shapes
A forecast is a range that should widen the further ahead it looks, so prefer fan charts to single lines, distrust "on track to" for anything seasonal, read best and worst cases as rare corners, and judge forecasters by how often their ranges caught what happened.
Calculator: Straight-Line Projection and Its RangeWorked examples 131–136
- What a hurricane forecast cone shows and doesn't
- An ice-cream stand's "on track for the year" from a winter quarter
- A fan chart for monthly orders built from past forecast errors
- A bike-share scheme's early growth stretched into a straight line
- Scoring last year's "80% sure" forecast ranges against what happened
- A season plan's best case built from two best guesses at once
Part Five · Ads, Rankings and Charts of Your Own
Claims in ads and reports are usually true but selected: "up to" is the single best case, "more" hides its comparison, "3 out of 4" hides its count, and "lasts up to" hides its test conditions. Find the best case, the comparison and the count, then work out the typical case and the price per unit.
Calculator: What "Up To" Really MeansWorked examples 137–142
- A store's "up to 70% off" sale, and the average discount across every item
- A "40% more" bottle that costs more per ounce
- "3 out of 4 riders prefer" from a test with eight riders
- Star ratings from seven reviews against 2,300, and what one bad review does
- A bike light's "up to 12 hours" battery, worked out for a real commute
- A "new bigger box" with fewer bars inside at the same price
A ranking keeps the order and throws away the gaps, so tiny score changes in a tight pack move ranks a long way, ranks built on small numbers reshuffle by luck, and composite scores depend on weights someone chose. Before trusting a rise or fall, find the scores, the count, the weights and the number of tries behind each score.
Calculator: Ranks vs ScoresWorked examples 143–148
- A town that "plunged" from third to ninth in a ranking, by less than a point
- How the weights inside a "best towns" score decide the winner
- Shooting percentages from twenty shots, reshuffled by luck
- Regression to the mean in a youth soccer league
- Points against points per game in a league table
- "Ranked 15th" for library visits: out of how many, and how far from the top
An honest chart says one thing in its title, uses the right kind of picture, starts its bars at zero, shares its scales, uses one axis per quantity, sorts and labels directly, points with color rather than decorating, shows its uncertainty, and names its source; every rule is a trick from this book turned around.
Calculator: Honest Chart MakerWorked examples 149–155
- Turning a spreadsheet's default bar chart into an honest one
- Writing a chart title that states the finding
- Three regions' monthly sales on their own scales and on one shared scale
- Highlighting one line among five instead of a tangle of colors
- Two customer surveys of 400 with their margins of error
- Three return rates that belong in a table, not a chart
- Writing alt text for a chart and checking its colors in grayscale
Ten questions, asked in order, catch nearly every trick in this book in about a minute: what's the claim; what's measured; where the axis starts; is it the right picture; percent or points, count or rate; who chose the window; what hides behind the average or the map; relative or absolute and how many asked; compared to what; and is it a forecast, an ad or a rank.
Calculator: The Sixty-Second Chart ReadWorked examples 156–160
- A vendor's renewal slide: a truncated axis and a cherry-picked pair of months
- A viral chart: a running total on a dual axis
- A storm map shaded by counts, redrawn as rates per 1,000 people
- An e-bike flyer's "up to 50% off" and "4 out of 5 riders"
- A "wettest September on record" from eight years of records